Illiquid assets 1s. Identification and work with illiquid stock (stagnant goods) and product shortages. "Document Execution Status"
Processing updates information about illiquid goods in the database (those that have not been sold for a long period of time) and records changes in additional item details.
First, we need to create the props itself:


It must be called Product status, one of its possible values must be named Unliquid. You can add any values you like, and for liquid goods, fill them in yourself:

You can set an automatic launch schedule (if the database is not file-based, but client-server):

Now let’s start the process (from the list of scheduled tasks):


If you have a file type database, then we start forcibly by clicking Run Now:

Upon completion, a new event will be created in the log book (JR):

In order to show how the product updates liquidity data, we will create a sales document for the product Sliced loaf and perform the procedure again.
We will see a new event in ZhR:

If after this the statuses of the goods have not changed, the following message will appear in the ZhR:

The illiquid status can be seen in the product card:

Also, liquidity can be displayed on various forms of selection, selection or list of items, using it you can configure sorting and selection in the list of goods:

Deadline for determining illiquid assets
By default, the period is 3 months, i.e. all goods that have not been sold in the last 3 months will receive the status of Unliquid. However, this rule can be clarified in terms of product categories:

To do this in the directory Product categories you need to create an additional illiquid property of a numeric type indicating the number of months to count:

The screen indicates that those electrical goods that have not been sold over the past 5 months will be considered illiquid.
This way, you will always have up-to-date (and visual!) information in your database about which products are illiquid.
Let's consider what capabilities the 1C Trade Management 11 program provides to its users for analyzing sales results.
UPDATE: added video “Sales analysis reports in 1C Trade Management 10.3”
From this video you will learn:
- How to analyze sales?
- How to build a sales report?
- How to view sales and balances in one report?
- How to build sales charts?
- How to view sales by payment?
Sales reports
By command "sales reports" We go to the sales reporting panel.
Similar articles:
- Tracking the movement of inventory balances in warehouses and...
- Formation of the assortment matrix and its…
The availability of reports in this panel is determined by whether the user has the appropriate rights to these reports, as well as by setting the visibility. Roles and rights are assigned to the user by the 1C program administrator. The user can control visibility himself using the command "Settings". In this case, checkboxes become available next to the panels; by checking and unchecking them, you can add or remove reports from this panel.
"Standard Terms of Sale"
Let's consider what opportunities we have for analyzing sales results. The first report is the “Standard Terms of Sales”. This report provides a list of standard sales terms, standard customer agreements registered in the system, and the basic information available in these agreements. Namely: name of the agreement; currency; type of price used; validity; our organization on behalf of which this agreement was concluded; business transaction (for example, sale or transfer to commission); taxation; stock; delivery time.
Price analysis
The next report is a price analysis. Available to us from documents such as commercial proposals, sales documents and customer orders. From each of these documents you can generate a report "price analysis". This report shows us information about the prices specified in the document (without a discount, with a discount), as well as about the prices of suppliers. Using this report, you can quickly analyze what prices we give to our customers and how they compare with the prices of our suppliers.
“Assessment of profitability of sales”
The following reports are also available from Sales Order documents. Namely, by opening the corresponding order, we can additionally display several reports in relation to this order.
The first of them is “Assessment of profitability of sales”. This report calculates the profitability of the order as a whole (including discounts, without discounts), and also provides detailed information for each item sold in this report. Now this report displays information about profitability of 100%. This is due to the fact that I have not yet calculated the cost price in my program for the current month, the routine closing operations of the period have not been carried out, and information on the cost price is not available. Accordingly, all proceeds are considered gross profit.
"Document Execution Status"
The following report is also available from the “sales order” ¾ this is the “Document Execution Status”. This report, firstly, provides information about the client’s debt (that is, how far the payment stages have been completed - say, advance, prepayment), information on shipment. And in the lower tabular part, in each product item, information is provided about what goods were shipped, in what quantity, for what amount.
Reasons for canceling orders
IN "Sales reports" There is a report on the reasons for canceling orders. This report collects information about the reasons why an order was canceled and provides quantitative indicators for each reason in terms of line cancellations in absolute and percentage terms. The information is also grouped by managers and by product price groups.
"Statement of settlements with clients"
The next report is “Statement of settlements with clients”. This report contains information on the status of mutual settlements with our clients. A list of our organizations and a list of clients is provided. The currency of mutual settlements is indicated. The counterparty on the part of our client is indicated. Information is provided on the debt at the beginning of the selected, analyzed period, information on the increase or decrease in debt, as well as the final balance and total balance.
"Customer debt"
The next report is “Client Debt”. This report shows information about customer debt. The information is grouped by debt currency. Information is provided about the client’s debt, our debt, settlement balances, as well as, based on information from the client’s orders, data on planned receipts from the client, planned sales to the client, or planned return of funds to the client.
“Dynamics of overdue debts of clients”
The next report is “Dynamics of overdue debts of clients”. This report shows information about the growth rate of overdue debt. In the tabular section, information is grouped by clients and managers. In our 1C Trade Management program (UT 11) 11.2, currently no overdue debt is registered (all debt is current), so this report is empty and does not contain any information.
Client payment discipline
A report on the client’s payment discipline can also be used for analysis. This report groups data by customer, provides data for the period on the number of sales orders, how many of them are overdue, what is the percentage of overdue debt and the average period of overdue, and also data at the end of the selected period.
"Customer debt by maturity"
The next report that may be useful in the analysis is “Customer debt by maturity”. This report must indicate the date on which the information will be analyzed, as well as the classification of the debt. We currently have one classification in the program. Each created classification indicates the periods for which the debt will be analyzed for overdue. The main postulate here is this: the most recent statements are the easiest to collect. The longer the period of delay, the more difficult it is to collect the debt. In this report, we receive information about each client, the status of mutual settlements with him, as well as information about the period of overdue debt.
Payment card with counterparty
From "Customer's order" You can get a report on the settlement card with the counterparty. This report displays information about mutual settlements for the entire period, that is, which documents were used to carry out monetary transactions, commodity transactions for sale or return. The total debt and information about its overdue status are also provided, if such data exists.
All these reports are available to us either in the section "Sales" in Group "Sales reports", either from settlement documents– documents used to document sales to a client, such as "customer orders" And "commercial offers to clients".
Such opportunities are provided to us by the 1C Trade Management program version 11.2 for analyzing sales results.

Creating a sales report by manufacturer and revenue 1C UT 8.3
This video tutorial describes how to build a report on sales by manufacturer and the revenue received from them in 1C trade management 8.3. The main point of the report is from which manufacturers’ products we receive the most income.
Retail sales analysis
To analyze the sale of goods by retail outlets, quite a lot of reports have been implemented in the configuration.
All of them are available in the section Sales.
Conduct assessment of goods balances in retail outlets according to the selected price type, it is possible using a report List of goods of the organization in item prices. In the report, we can set the selection by store and by the type of price that is assigned to the store. We also determine the reporting period.

This report reflects the Beginning and Final Balance, Income and Expense, for each item.
We can customize this report in more detail. For example, we are only interested in information on the Coffee nomenclature and specific dates for the movement of this product.
To do this we go to Settings and on the bookmark Selections select the desired product.

As a result, the report we needed was generated. From the report we see that at the beginning there was no balance in the Maxi Store, on 06/27/2016 there was a receipt of 100 units, and on 06/29/16 there was a sale of two units. Total at the end of the period the balance of coffee is 98 pieces.

For control of funds at the KKM cash desk use the report Cash in KKM cash desks.

In the generated report, we see the Beginning and Final Balance, the Amount of Sales and Receipts of DS, as well as the withdrawal of DS by day.
We can generate this report with details on documents; to do this, in the report settings, set the checkbox to the value - Registrar. As a result, a report will be generated in the context of documents (registrars).

If the ending balance is minus sign, then the store did not fully account for the goods sold.
If the balance at the end of the period positive, then the retail outlet did not fully pay for the goods sold.
If we are only interested in information about the amounts received from the company’s cash desk, then in the advanced report settings, on the Fields and Sorting tab, we clear all unnecessary checkboxes; only the checkbox for the value Entering DS remains selected.

As a result, a report of the following type will be generated.

The program has the ability to generate a report in a regulated form Bargaining-29. This report is designed to analyze retail sales. The report reflects balances at the beginning and end of the month, as well as documents used to document the movement of goods through the specified warehouse and the specified organization. The total indicators in the report are calculated according to the price type specified in the card of this warehouse.
Prices are filled in according to the values that are valid on the report date.


Analysis of demand for goods
To analyze the demand for goods, you can use ABC and XYZ sales analysis. ABC analysis is possible based on several indicators. ABC analysis of sales by sales volume allows you to distribute goods into ABC classes in terms of demand for goods by customers. Class A will include the most in-demand goods, and class C will include the least in-demand.
Conducting an XYZ sales analysis allows you to determine the stability of product sales. From the point of view of sales of goods, XYZ analysis allows us to divide goods into the following classes - stable demand for goods, trends towards increasing demand for goods, one-time purchases (irregular consumption).
Carrying out a combined ABC and XYZ analysis will make it possible to determine the optimal inventory management method(that is, plan to purchase only those goods that are consistently purchased in total volume).
The program supports several inventory management methods: volume scheduling based on demand forecast, " order by reorder point"(with a fixed volume or with a regular delivery interval), " made to order". Different replenishment methods can be assigned individually to each product in each warehouse. The inventory management method can be determined automatically based on ABC/XYZ classification of reserves. It is also possible to manually change the inventory management method.

Example. In accordance with the conducted ABC/XYZ classification of reserves goods are assigned to group AX (goods are sold consistently and have a high turnover, that is, they bring high income to the trading enterprise). For such goods, a method is established "Scope and calendar planning". Method "Order to order" is established for goods that belong to group AZ. For such goods, no stock is kept in the warehouse; the goods are ordered from the supplier only when a customer need arises (placing a customer order). Information about the presence of such goods in the warehouse is recorded in the report as excess stock and marked in red.
When analyzing the demand for goods, product restrictions (regulatory, minimum, insurance, maximum stock) are used. Product restrictions are calculated automatically using a regulatory task for each product item in each warehouse based on data on sales of goods.

When calculating the required (standard stock), the expected sales volume of goods (minimum stock) and possible surges in sales (safety stock) are taken into account. For additional insurance against the risk of shortage of goods, you can manually set a parameter such as the maximum stock of goods.
Filling out a sales plan using a formula
The video will help you navigate the types of needs, as well as understand why enterprises distinguish between these types.
Formation of orders according to plans
For some products, supplier lead times are very long, and it is impossible to order supplier goods to meet current needs - orders must be placed in advance. For such goods, it is proposed to form long-term purchasing plans and form orders to suppliers based on these plans.
Documentation procurement plan in the program can be formed both manually and automatically, based on various data sources from the program itself. As sources for the forecast, you can use: data from customer orders, sales volume over the past period of time, volume of purchases over a certain period of time, etc. You can also take into account the internal needs of the enterprise (orders from your own departments, orders from retail outlets, your own stores, the need for components for assembly, etc.). In this case, it is possible to add several sources, as well as select the maximum value from all sources.

For example, you can select a maximum value based on the sales volume for the previous month and all purchase orders and internal orders issued for the same period or the same period last year.
The list of planning data sources can be filled in as desired. Templates are used to fill out.
Orders to suppliers are formed in accordance with the drawn up plan, and the deviation of the planned and actually ordered quantities from the supplier is controlled. Thus, purchasing plans can also be used to verify the implementation of plans dictated by the supplier itself.

Monitoring sales indicators
IN "1C: Trade Management 8" There is a mechanism that allows you to promptly identify “problem” areas and can help you make the right management decisions, and, in addition, automatically inform you about situations where the state of indicators is still acceptable, but is already approaching critical.
So-called "Target Monitor" allows you to analyze the key performance indicators of the department and the enterprise as a whole and the degree of achievement of the set goals, taking into account the target trend (increase in the indicator, decrease in the indicator, keeping the indicator in a certain range). Information can be available to a manager anywhere in the world by accessing the “Target Indicators Monitor” functionality via the Internet.
In order for this to work, it is necessary to define the goals that are planned to be achieved. Each goal can consist of many subgoals, the successful achievement of which ensures the achievement of the fundamental goal.
Each goal is given a target indicator. In turn, for each target indicator, the target trend is indicated - the desired direction of changes in the indicator over time (minimization, maximization of the value or keeping within the acceptable value), and analysis options are configured.
For example:
The fundamental goal is revenue growth. This goal is planned to be achieved by increasing the number of customers and increasing the average sales amount. In turn, an increase in the number of clients is planned by attracting new clients and reducing the number of lost clients. And the increase in the average sales amount is planned by reducing the provided manual discounts.

Dealing with illiquid stock in a warehouse is a good way to free up money and increase turnover. That's why most executives make regular demands from their managers. Those, usually, simply create a statement of balances and compare the “sales” column for the period and the “current balance”. And since this is terribly inconvenient and time-consuming, people constantly turn to us for an alternative way to search for illiquid assets.
Usually, illiquid goods are understood as goods that have not been sold for too long. Two years ago we bought an unsuccessful model and it is still on display, no one takes it.
This also includes stocks of goods that will take too long to sell out, even if they are in demand.
Let's say a supplier gave me a super discount and I purchased from him 100 units of a new product that was not sold in the store before. Those. I don't know whether he will go or not.
Based on the results of the first couple of months, it can be seen that 1-2 pieces are spent per week. If the sales rate does not change, I will sell the 90 pieces that are now in the store for about another year.
With the help of such a simple calculation, you can see in advance possible illiquid assets. And take some measures in advance to quickly push them away, increasing turnover.
And the profit received depends on the turnover, although to a lesser extent than on the markup.
I will show this dependence with an example:
- I buy an item for 200 rubles, sell it for 300 rubles. (50% markup), has been on the shelf for 1 year, earned 100 rubles. in year
- I buy an item for 200 rubles, sell it for 250 rubles. (25% markup). has been on the shelf for 6 months. earned 100 rubles. in a year.
By the way, this clearly shows why you can’t make discounts if it doesn’t increase turnover. In this example, we cut the markup in half, although the buyer only saw a 15% reduction. If this does not double our turnover, then we have simply reduced our profits instead of attracting customers.
.The program works exactly as I showed above - it calculates the sales speed and predicts the number of days it will take to sell its current balance.


- This example (taken, by the way, from the database of a real store) shows products with inflated balances:
- The first line - 18 pieces were sold in six months (177 days), and now there are 36 in stock. This remainder will be sold out for another year.
- Second line - 10 pieces were sold in 232 days, now there are 50 in stock. It will be sold out for about 3 more years.
- Third line - 108 units sold during the year, now there are only 5 units in stock. With such dynamics, it will be enough for half a month. This is certainly not an overestimate, but a completely normal balance.
Nearby, in the “Frozen amount” field, there is an approximate estimate of the surplus in purchase prices. A negative amount indicates that it is advisable to replenish the balance - there is not enough goods.
Of course, the number of days in stock alone is not enough to classify a product as non-liquid.
We need to consider how much money we can invest in the warehouse, whether the product has an expiration date, the size of the discount that the supplier gave us for volume, the delivery time of the product from the supplier.
Products obtained from the report can be
- assign a price group to “Unliquid” or “Sale”
- Such a product can be highlighted in color in the general list of products.
- it is convenient to track sales and product balances through reports
- automatically fill out the “Setting prices” or “Setting discounts” documents.

Highlighting a product in color will give sellers and managers a visual signal that the product is not selling well and they need to make more efforts to sell it - look for additional arguments for the buyer or offer him special conditions.
Good day, dear forum users.
I studied the developments available on the resource, it seemed a little, and decided to put my two cents in for your judgment.
Purpose of the tool: identification of illiquid assets and deficits.
Difference from analogues:
Working with a table field rather than a spreadsheet document
More useful information fields
Detailed information on the movement of items in a separate window
Explanation of settings:
Date from, Date to - understandable;
Selection by product range and warehouse - it’s clear, it works (IN THE HIERARCHY);
Type of prices used - used when evaluating a warehouse;
The optimal period of liquidity is the golden mean of stock balances. The value means a period in months equal to the sales volume that we want to store in the warehouse. It is clear that different items may have different liquidity periods; this mainly depends on the frequency and delivery time. As a rule of thumb, the liquidity period should be equal to (approximately) the period between 2 deliveries plus the delivery time, and plus the clearance time. Those. for example, we deliver goods once every two weeks and in order to get delivery you need to place an order no earlier than 3 days in advance, and it will be on the road for 2 days, then optimally it will be 3 weeks (7 * 2 + 3 + 2 days), or 0.7 in program terms. When working with the program, I recommend setting a value of at least 1 at the first stage. The parameter is used to calculate the frozen amount in the warehouse. This coefficient may also include all sorts of risks, such as delivery failure.
Upper and lower liquidity thresholds - cutting off items by liquidity, for example, to see only illiquid items.
Explanation of fields:
Selected- a checkmark by which we determine the items with which we will do something, for example, inventory.
Nomenclature- It's clear.
Nomenclature group- it is clear to sort the list into groups (pseudo-grouping).
Characteristics of the nomenclature- It's clear.
Nomenclature series- It's clear.
Remainder- a snapshot of the latest ProductsInWarehouses register based on the report settings.
Buyer reserve- It's clear;
Order to suppliers- It's clear;
Remaining to be assessed- the amount of the balance and the order to suppliers, minus reserves.
Total consumption- consumption according to the GoodsInWarehouses register according to the report settings.
Average monthly consumption- total expense divided by the number of months in the selected period. If the first receipt of goods was later than the beginning of the period (new product), then the number of months is taken from this receipt.
Liquidity- the balance to be assessed, divided by the average monthly expense (I agree that it’s rough, but quickly and in 95% of cases it’s enough).
Price- price of the item according to the selected price type.
Warehouse valuation at selected prices- It's clear.
Frozen amount- valuation of the warehouse at selected prices, minus the optimal liquidity period. Those. for example, if we have optimal liquidity equal to one month, and the balance in the warehouse corresponds to the average monthly sale, then the frozen amount is zero.
Admission price- average price from the register of Lots of Goods in Warehouses, i.e. average price of goods from unsold receipts. Verified only when maintaining batch records in warehouses.
Warehouse assessment based on receipt- assessment of the warehouse in batch prices. Important: the quantity is taken not from batches, but from goods in warehouses.
Detail table:
The monthly expense, income, final balance and days left are displayed. In contrast to the standard report “Statement of goods in warehouses,” zero months have been added for clarity. Selection occurs when a row is selected in the main table.
The table can be opened/retracted using the corresponding button on the command panel.
Actions with selected positions:
Setting prices- the document “Setting item prices” is generated with the selected price type and selected item items. The managerial sense is that the price is high, it needs to be lowered. I will warn managers that this needs to be used in conjunction with other actions. Those. if you lower the price, but no one will know about it, then the use of this action is NULL.
Inventory. Managerial sense - maybe the product is lost in the warehouse, has become over-sorted, so it is not sold, and you need to find it.
Write-off. Managerial sense - if the product is dead, dead. There can be all sorts of reasons: defects, junk, non-core business, etc.
Task. The managerial sense is to set a task in the information system with a list of identified illiquid assets. These could be sales managers, purchasing managers, and department heads. The selected item items and their liquidity are inserted into the task description. The text of the task, of course, can be manually supplemented with inspiring phrases like: “What the *nya is this??!!”
Additionally, there is a transition for the selected item to the report list of goods in warehouses.
Perspective and other thoughts.
The topic of categorization of nomenclature is not covered. If we take the BCG matrix (Boston) as a basis, then it is logical to break down the analysis of illiquid assets for each group: “cows”, “stars”, “dogs” and “problem children”. “Cows” need to be analyzed every week, while “dogs” are enough once every three months. Do you think it's worth it? Accordingly, it will be necessary to add selection based on the properties of the item if the implementation will be through them.
I also believe that it would be more correct to make liquidity not general, but by item groups, or by supplier, if there is only one for the item.
It is important to understand that a shortage of goods is just as dangerous for business as illiquid stock, so don’t get hung up on illiquid stock.
You also need to understand that this is a late-acting tool, i.e. illiquid stock or deficit already exists when we saw it. Of course, it can be pressed online as much as possible if you use orders to suppliers and customer reserves. But ideally, to combat illiquid stock and shortages, you also need to automate the work process of the purchasing manager, but I want to talk about this next time.
That's it, thanks for your attention!
Main purpose of publication- discussion of the correctness and convenience of the tool. Of course, I would really like to hear the opinions of people knowledgeable in the topic.
By openness of the code: everything is open.
The certificate indicates additional management actions that go beyond the scope of 1C.
If something is not It's clear- write, I will answer.
UPD 2015.02.19 (v.1.5.2):
- Added work with item series.
- The list now also includes positions with a zero balance, for which there were movements - obvious deficits. There were only remnants, now remnants and revolutions. (thanks to Pasha for the right advice).
- A column has been added to the detailing - days without remainder.
- Minor bugs fixed.
Mini-story about planned illiquid assets (2015.02.19):
Several times already I have come across enterprises that have (I apologize for the tautology) planned illiquid assets, here is an example:
Sale of sockets. There is such a position - a computer socket. Its share in the turnover of other outlets is 0.01%, if not less. But then a customer comes to purchase for the installation of a large, fashionable private home. It takes a long time to choose a color, model, etc. It comes to placing an order, he has 300 different not the cheapest sockets and a bunch of additional fentiflyushki. And oh my God, he needs 2 computer sockets, but they are not in stock! And the client tells you, sorry, I need it in the same style, and leaves. This is more than possible. And the store is forced to keep a year's supply of these computer sockets.
UPD 2015.02.25 (v.1.6.1):
- In the command line, a transition to the list of goods in warehouses for the selected item line has been added.
- Now, when calculating average monthly sales, zero months that were before the first arrival are not taken into account. Those. if it is a new product, it is very relevant for a constantly updated assortment. This increases the reliability of the frozen amount.
- Fixed minor and major errors.
- Slightly improved usability.
UPD 2015.04.03 (v.1.6.3):
- In the command line, a transition to the list of orders to suppliers for the selected item line has been added.
- IN Added input to the command line based on the "Order to Supplier" document.This is true for shortages. Processing tries to place an order against the main supplier of the item. The quantity entered into the document is equal to the difference between average monthly sales and the current balance for the assessment. Just use it carefully so that items on order do not end up there. In the future, perhaps I will link it to the method of ensuring stock (order point).
- Now the series of the nomenclature are collapsed, previously the analysis was in the context of series.
- The option "Take into account/ignore customer reserves" has been added to the settings.
- The interface has been significantly redesigned. Since there were many columns, we divided them into quantitative and summative. Switching viewing modes on the command line using the numbers "1" and "2".
- The "Liquidity" column is now highlighted and placed in front, since this is the main "pivot" of processing.
UPD 2015.04.10:
An improved version of the " " report has been published, which allows you to automatically calculate the order point and subsequently create an order for the supplier. This report is positioned as the first line to avoiding illiquid stock and shortages. In turn, current processing is the second line of working with illiquid assets and deficits when they already exist.
An illiquid product is a product that is not sold or sells very poorly and is in the warehouse for more than 3-6 months (depending on the category of the product). Stale goods not only do not bring profit, but because of them the company incurs huge losses. In addition, no one needs old models of goods anymore and they just lie in the warehouse.
Obviously, such a product needs to be disposed of as soon as possible, the reasons must be identified, and it must be prevented from happening again. But how to identify a poorly selling product?
All this and much more can be easily done with the report “Analysis of illiquid goods for 1C: Trade Management”.
HOW TO FIND UNLIQUID PRODUCT IN 1C 8.2 and 8.3
There is no standard report for identifying illiquid goods in 1C Enterprise. That is why we have developed such a report, which is already used by hundreds of wholesale and retail stores in Russia that keep their records in 1C. Now we will very briefly describe how the report is generated and you will understand why such a report cannot be created manually.
To identify illiquid assets, data is collected from five reports: sales for the period, warehouse balances, retail balances. For each product, data is compared and its sales rate is calculated. Moreover, balances are taken not only for the end date, but for every day in the specified period. This is the only way to get a real speed of selling a product (after all, if a product was out of stock for 10 days, then for this reason it was not sold, but could have been sold). Also, thanks to this, the real number of days the goods are in the warehouse is revealed.
Having received the rate of disposal of goods, the program calculates how long the current balance of goods will last, and according to the specified criteria classifies it as liquid or illiquid. Next, the program pulls up information from two more reports on cost and retail prices and shows the current markup. This will help you decide whether it is possible to get rid of illiquid assets by reducing the price, but making a profit.
Below you can clearly see how to work with the report. Look:
Report settings for identifying product liquidity
In the main menu of the report, we set the date on which we need to obtain warehouse balances and determine the liquidity of goods. We can specify selections by warehouses and goods on the “Selection and Sorting” tab.
Here we indicate the period for which sales will be analyzed (we can specify which divisions to take into account).
We set the parameters according to which the goods will be divided into illiquid and liquid. It could be:
- number of days the product is in stock(for example, if a product arrived 10 days ago and there are no complete sales statistics for it yet, it is better not to classify it as illiquid stock for now);
- number of days to sell off balance— if the current balance will be sold for more than 90 days, then most likely it is illiquid (the number of days can be changed)
Sales analysis results
After analyzing sales for the period, we get the first input data:
- Number and amount of sales for each product;
- We determined how many days the goods were in the warehouse;
- We calculated the speed of product sales per day/month. It is important that when determining the speed, we take into account not the number of days in the period, but how many days the product was actually in the warehouse. For example, 300 laptops were sold in a year, but they were not in stock all year round, but only 200 days. Therefore, when determining the sales speed, we divide 300 not by 365 days, but by 200 days. Because if the goods were in stock on other days, there would be more sales.

Analysis of current balances
We add data from the report on balances and determine the quantity of goods in the warehouse on the specified date. Dividing the remainder by the sales speed, we get Estimated sale period(i.e. how many days before we can sell the goods that are in the warehouse)

Products not sold in 1C
In this way, they identified products that will be sold for several more months or even years (you will be surprised, but there are such). To complete the picture, we add data from the third report and see the cost of the current balance:

Analysis of the causes of illiquid goods in 1C
Why did the product become illiquid? Perhaps the buyer brought a lot, perhaps the product is not presented on the display, or maybe it is simply overpriced? We pull the data on sales prices into the table and calculate the current markup:

Markdown of illiquid goods in 1C*
Having identified illiquid assets and analyzed the markup, we can immediately assign a discount and form a new price. With one click, prices will be transferred to the document “Setting item prices” and recorded in the database.

*This feature is only available in configurations: 1C: Trade Management 10.3. 1C: Integrated automation 1.1 and 1C: Manufacturing enterprise management 1.3
How to look in 1C: How many days did the product not sell?
To facilitate the analysis of information, from the report you can find out the date of the last sale of the item and how many days have passed since the date of the last sale (this way you can determine how many days the product has not been sold and has been lying motionless in the warehouse):

 Frontal lesson in the senior speech therapy group "Ryabinka" on the topic "Festival of Friendship" vowels and consonants sounds and letters
 Differentiation of sounds Сь - Ш in syllables with different vowel sounds
 Stanislav Duzhnikov: there must be many good people
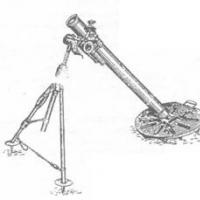 Experience in the combat use of mortars Flight range of mines from a mortar 80 mm
 Konstantin Mikhailovich Simonov, alive and dead Before the evening drive, another meeting took place
 US Eighth Air Force Museum 8th Air Force
 Academy of Military Sciences of the Russian Federation GDz in the discipline general tactics