Warehouse balances in 1C 8.3 accounting
In order to sell a product you need to know whether it is in stock. An obvious and understandable thing. But not every 1C user imagines where and how to view product balances in 1C. In this article we will talk about ways to view and analyze balances in 1C for sales personnel, managers, and analysts.
All inventory balances in 1C are formed by receipt and disposal documents. No product can be included in the program on its own. If you configure the report accordingly, it is possible to calculate the history of any product for any period, and view its entire history, if necessary.
The remaining goods in 1C are stored in quantitative and monetary terms. The balance of goods is formed from the balance of capitalized and unsold (not written off goods) according to the formula:
Final balance = Initial balance + Income - Expense
This formula can be easily checked with a simple report “List of goods in warehouses”. Read more about how to use this report in our publications on reports in 1C.
In addition, the entire balance of goods is still divided into free and reserved. What does this mean? Often, trading companies, in order to hold goods for a client, carry out a reserve operation in 1C. Accordingly, the product is not removed from stock, but is not available for sale (reserved). So, if the company has adopted a policy of reserving goods for the client, you should also pay attention to this. A situation is possible when out of 100% of the goods on balance, all 100% are reserved. By relying on such a reserved product, the sales manager may unintentionally mislead the buyer. The deal will have to be cancelled.
For the sales manager, the remainder is:
Free balance = Total balance - Reserved
It is the free balance that you need to focus on. Very quickly, the free balance can be viewed in a utility specially developed by 1C implementers for managers - “Assistant Sales Manager”. In this processing, not only free balance is visible, but also storage locations and even prices.
Managers and financiers will be interested in the amount of balances in monetary terms. The data can be obtained using the report "Statement of batches of goods in warehouses". The report shows the balance of goods at cost, i.e. at the prices at which it was bought. With the help of additional settings, it is possible to find out even from which purchase batch the goods were left.
Logisticians, marketers, and analysts will be interested in information about balances during the period. The report "Analysis of Goods Turnover" is intended to analyze the average delay time of goods in a warehouse or with commission agents.
- For each product, the following indicators are calculated: average balance for the period, consumption for the period, turnover ratio and average shelf life in days.
- The turnover ratio is defined as the ratio of the quantitative consumption of goods for the period (minus returns to suppliers and returns from customers) to the average balance for the period.
- The average residual value is calculated as the sum of residuals for each control point divided by the number of control points.
- The number of control points for calculating the average value is calculated based on the period specified in the report and the frequency selected by the user in the report. For example, the data in the report is analyzed for a week, the frequency specified in the report is daily. The number of calculated control points will be 7.
- The control point of the beginning of the period is always added to the calculated quantity. Thus, the number of control points will be 8.
- The average shelf life in days will be calculated as the ratio of the number of days in the reporting interval to the turnover ratio
Thus, at almost any time, 1C is ready to answer the question of what, where and in what quantity is stored in the company’s warehouses, is available for sale, and how much money is currently mobilized in inventory.
Not only an accountant needs to know the number of goods in stock on a specific date; such information is needed for planning purchases and controlling sales. You can generate a reporting sheet in the software package “1C: Trade Management edition 11.0”, “Taxi” interface in several ways; in addition, the settings allow you to display not only the total quantity of the item, but also analyze the inventory in a specific warehouse cell, clarify the movement of goods for period including reserve. Before you look at the balances in the warehouse in 1C, you should determine which report will be more convenient to do this with.
Overview of warehouse reports
All main reports regarding product balances are located in the “Warehouse and Delivery” tab.
Each report is designed to present information differently. To decide how to view warehouse balances in 1C, let’s consider all the features of analytical forms. To select the required report, you need to open the tab with the left mouse button and generate indicators by clicking the corresponding button.
All tables can be printed, you must first open the window in viewing mode, and also save to a file or send by e-mail. Let's look at the features of creating each reporting form to view warehouse balances.

List of goods movement in the warehouse
In this table, you can clarify not only the balances of goods in the warehouse, but also their movement for a certain period of time or as of the date of the report.

The “Warehouse balances” report generates the quantity of items for all storage addresses by default, if a specific warehouse is not selected. In the “Settings” tab, you can check more detailed inventory analytics.
- In the “Selection” tab, use the “Selection” button to configure the generation of a report on a specific product item, product range, or product groups;

- In the “Fields” tab, you set the analytics parameters for the formation of warehouse balances. To do this, you need to check the cell in the left field, then use the arrow to move it to the right field. The hierarchy order in the right margin is formed by the arrows at the top of the panel. With their help, you can prioritize the reflection of product items.
To prevent unnecessary information from being reflected in the reporting form, you can uncheck the box in the left field;
- After selecting analytics, you need to create a report on the balance of goods in warehouses by clicking the “Close and generate” button.

To search for a product item in the generated report on product balances, use the “Find” button. This is a convenient search if the company has a large inventory of inventory. The analysis can be performed not only by the full name of the product; it is enough to enter part of the word.

The settings for the “List of goods in warehouses” report are configured in the same way. It is formed for the enterprise as a whole or for each specific warehouse; you can also set any period for data reflection.

By double-clicking the left mouse button on the quantitative balance or movement of goods, you can open the income or expense analytics.

Warehouse inventory turnover
This report generates inventory analytics. The form is intended to determine balances, control their movement, identify low-turnover groups, in addition, it can be used to estimate the quantity of items for the items of interest.

In the “Settings” tab, you can select the following parameters.
- Analysis of turnover of commodity items for a certain interval;
- Type of price - the analysis will be generated only in relation to wholesale, retail, dealer or other types of prices that are provided at this enterprise;
- Stock;
- Type of nomenclature;
- Classification type;
- In the “Selection” tab, if necessary, you can sort the analyzed positions.
After you finish selecting the settings using the “Close and Generate” button, the reporting data will be reflected on the screen.

Remains and availability of goods
This report generates balances for the warehouse or the enterprise as a whole only as of the current date. It is designed to analyze the following data.
- Quantitative balance of goods;
- Reflects the number of positions placed in reserve. They are highlighted in red and have a negative value;
- Available balance, which is calculated taking into account the goods in reserve;
- Expected amount of income and expense;
- The expected quantity of goods for a given date, taking into account the reserve, income and expense;
- Available quantity of goods by dates. It may change as new documents are processed.
All settings are made in the corresponding tab; the selection principle is similar to previous reports. After selecting analytical data, the report is generated using the “Close and Generate” button.

Similar data can be performed in the “Commodity Calendar” report; it analyzes balances for specific dates, taking into account the receipt of goods, sales and reserves. The program will also tell you which items are already expired.

Report “Statement of item series”
This form allows you to clarify the movement and quantity of a specific product item. This may be necessary, for example, to identify controversial issues regarding the quality of a product or batch, shipment and remaining defects.
In setup mode, you need to select the following options.
- Data analysis period;
- Product item;
- If necessary, you can narrow the search by filling in the “Series” and “characteristics” fields of the product. This is doable provided that the data was initially entered into the item card.
Using the “Close and Generate” button, the reporting form will be displayed on the monitor.

Remaining goods by expiration dates
In this report, you can control inventory taking into account expiration dates. This is a convenient report not only for food residues, but also for cosmetic products, household chemicals, pharmacology, and veterinary medicine. To do this, in the “Settings” tab, you must first select the expiration date, the limit of which should be monitored.
- Expired products;
- 0-20%, 20-40%, 40-60%, 60-80% left before expiration;
- View perishable product items, as well as items with an expiration date of more than a year.
Information about the expiration date must be entered manually into the product card upon arrival. For a detailed analysis, the report allows you to select a narrower category of inventory, as well as identify a specific warehouse for selecting analytics.

Inventory in operation
The report allows you to quickly generate information about product items transferred and returned by employees or other individuals. The program provides analytics for the following positions.
- Analysis of balances in relation to all individuals or allows you to select a specific person;
- Analysis of the balances of the entire product range or a separate product item;
- Clarify the status of production of an item's resource.
The “Close and generate” button will display the report on the screen.

Conclusion
You can view product balances in the “1C: Trade Management version 11.0” program, “Taxi” interface using various reports, the data is generated not only in quantitative terms, but also in total. In addition, expanded forms help analyze the movement of items throughout the enterprise, at a specific warehouse, or just one product item. The software package will tell you which goods are reserved, this is convenient if several people are involved in shipment.
The planning and performance of not only the purchasing and sales departments, but also production as a whole depends on promptly obtaining information about the amount of inventory assets a company has. Maintaining warehouse accounting in 1C will allow you to receive up-to-date data using the necessary filters.
If a company has several warehouses, setting up warehouse accounting must begin with the introduction of two or more accounting locations. To do this, you need to find the “Warehouses” section in the “Directories” - “Goods and Services” menu.
Fig.1

Fig.2

Fig.3
We sequentially fill in the fields of group, name, and responsible person. Similarly, we create Warehouse No. 2 indicating the name as “Retail”.

Fig.4
Thus, we formed two warehouses: No. 1 and No. 2.
For correct accounting, you must enter balances at the beginning of the year. To do this, in the “Main” menu we find the “Balance Entry Assistant” tab.
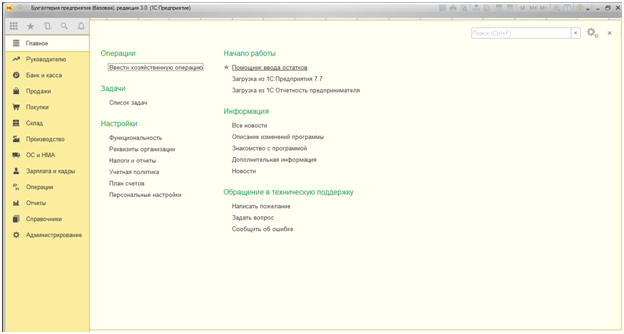
Fig.5
The balance entry assistant window opens, in which we select the balances for which account we want to enter. In our case, this is account 41 “Goods”.

Fig.6
The document date of 12/31/2017 is set automatically, since in our settings it is set that the balances were visible on 01/01/2018 (if the document date is January 1, the amount of the balances falls into the turnover of the current year).

Fig.7
Remaining goods can be checked in the menu “Warehouse” - “Reports” - “Remaining goods”.

Fig.8
In the window that opens, set the date on which we want to check the balance and click on the “Generate” button.

Fig.9
The receipt of goods into the organization is documented in the “Purchases” section with the document “Receipts (acts, invoices)”, which is registered with the line “Warehouse”.

Fig.10
Hovering the cursor over the line “Warehouse” leads to the possibility of choosing which warehouse to receive the goods arriving on the invoice.

Fig.11
We choose Warehouse No. 1 “Wholesale”. For example, let’s fill in the name and quantity of the delivered product – “Computer included” in the amount of 80 pieces.
The most common type of movement of goods is movement from a Wholesale warehouse to a Retail warehouse (transfer from a warehouse to a store, for example). To do this, go to the “Warehouse” section and go to the “Movement of Goods” subsection. A journal for registering moved goods opens, in which it is necessary to generate an electronic document “Movement of goods”.

Fig.12
After filling in the date of movement of the goods, fill in the “Sender” column, selecting the Wholesale warehouse, and then the “Recipient” column - in our case, this is the Retail warehouse. In the “Nomenclature” line, using the “Add” or “Selection” buttons, we will transfer 50 pieces of “Computers included” from the “Wholesale” warehouse to the “Retail” warehouse.
After completing this document, we again generate the “Remaining goods” report.

Fig.13
The 1C program for warehouse accounting simplifies as much as possible the procedure for disposing of materials and goods from the warehouse. Next, let's look at an example of writing off materials for production. The write-off of material for production is documented in the “Requirement-invoice” document.
To register it, you need to go to the “Warehouse” section, then the “Warehouse” subsection, then find the line “Invoice requirements”.

Fig.14
In the window that opens, you can immediately select the warehouse from which you are going to write off materials for production. This function is active until you click the “Create” button.

Fig.15

Fig.16
When filling out the necessary details, there is a “Warehouse” line on the right, which allows you to select from which warehouse the materials are written off for production. In our example, Warehouse No. 1 is Wholesale.

Fig.17

Fig.18
Note! We specifically placed the quantity of materials in excess of the actual availability in the warehouse. The system allows you to write off materials in excess, since in the menu “Administration” - “Post documents” (Fig. 19) we have checked the box in the line “Allow write-off of inventories if there are no balances according to accounting data.”

Fig.19

Fig.20
If you uncheck this box, the program will prohibit posting a document for writing off materials. Below we will describe how the system controls negative balances.
Inventory of goods
Automation of warehouse accounting also implies electronic registration of inventory results. For this purpose, the following documents are provided in the “Inventory” section:
- Inventory of goods;
Let's take a closer look at all three documents.
We will conduct an inventory of goods in Warehouse No. 1. To do this, select the document “Inventory of goods”.

Fig.21
By clicking the “Fill” button, the document displays information on balances based on accounting data. Let us remind you that after moving the goods, we still had 40 “Computers included” in our warehouse. Let's assume that there are actually 39 computers in the warehouse. To do this, edit the “Actual quantity” column. The program automatically calculates the amount of deviation with a minus sign and highlighted in red.


Fig.23
To further reflect the inventory results in accounting, you need to post a document “Write-off of goods”.
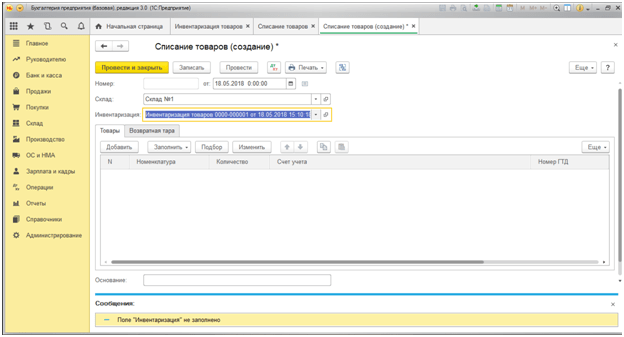
Fig.24
In the “Inventory” line, the program allows you to select the document that served as the basis for writing off the missing item. After selecting this document, click the “Fill” button. 1C Enterprise provides for automatic transfer of data from the selected document without re-entering.

Fig.25
Here it is worth paying attention to the column “Expenses (OU)”. In accordance with the accounting policy, when carrying out this document, damage should be written off directly as expenses or not taken into tax accounting.

Fig.26
The report shows that there are 39 computers in stock.
Let’s assume that, based on the results of the inventory, we have, on the contrary, a surplus of 2 computers.

Fig.27
As when writing off goods, in the “Posting of goods” you need to select the basis document “Inventory of goods”, information from which is also automatically pulled into the new document.

Fig.28
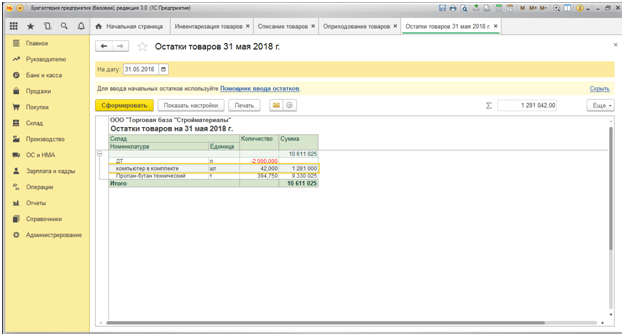
Fig.29
In the pictures presented above, please note that according to the product range DT (Diesel fuel) there is a negative balance of 2000 liters, that is, we shipped a product that we actually did not have in stock. From this we conclude that the program did not reflect the supply of diesel fuel from our suppliers. To eliminate such moments, automated warehouse accounting is supplemented with the document “Control of negative balances,” which can be found in the “Warehouse” - “Reports” menu.


Fig.31
When control of negative balances is disabled, this report allows you to effectively and timely track the receipt and reflection in accounting of material reports of responsible persons, and also eliminates misgrading in the product range. Otherwise, the program does not allow you to post the corresponding document.
How to view stock of goods in 1C?
An accountant often compares the amount of inventory items in warehouses. You can do this like this: Reports – Revolving account balance sheet – period for displaying the balance – sample account – create.
What is better than the remaining goods in 1C retail?
This is a very convenient way to compare inventory balances by warehouse: Warehouse – warehouse reports – select the desired report.
How to create balances of goods in 1C accounting?
Service – Additional reports and processing (Custom reports). This is the easiest way to see accounting balances and compare them with the warehouse.
How to correctly generate a report on product balances in 1C?
To perform these actions, you need to go the following way: the report “Statement of batches of goods in warehouses”, Reports – Inventory (warehouse) – List of batches of goods in warehouses. Please note that the report is generated in purchase prices. You need to go to the settings and check the boxes for cost, quantity, final balance. To view a report for only one warehouse, you must enable the condition for the warehouse or counterparty.
Let's consider the procedure for unloading balances when working in 1C: Retail version 2.2
Step 1: Open the report
In the left menu, select Warehouse, then Warehouse reports.
Rice. 1. Menu “Warehouse”, section “Warehouse reports”
In the form that opens, in the Warehouse operations item, select Warehouse balances.
Rice. 2. Section “Warehouse reports”, item “Warehouse balances”
In the report you can select by parameters:
-
Nomenclature
Then click the “Generate” button.
Rice. 3. Report “Warehouse balances”
Let's consider the procedure for unloading balances when working in 1C: Retail version 2.1
Step 1: Open the report
In the top menu, click Warehouse, and in the field on the left - warehouse reports. Next - the balances in warehouses.
Rice. 4. “Warehouse” menu, section “Warehouse reports”
Step 2. Setting up selection and generating a report
Selection can be done in the same way as in version 2.2. Then click the “Generate” button.
Rice. 5. Report “Warehouse balances”
What else you need to know to work in 1C: Retail
How to save a report to your desktop
Click on the blue floppy disk sign or use the keyboard shortcut Ctrs + S. Select the format and save location.
Rice. 6. Saving the report
How to track balances in the 1C: Retail program
In the Sales section there is a report Sales analysis and order generation. It will help you understand when and how much goods need to be purchased.
Rice. 7. Report “Sales analysis and order formation”
How to unload balances with prices
Step 1. Select Warehouse, then Warehouse Reports.
Step 2. In the block that opens, click on Warehouse valuation (in prices by price type).
Step 3. Enter the data in the selection and click the Calculate button.
Rice. 8. Menu “Warehouse”, item “Warehouse assessment”
If you still have questions about creating balances in the 1C: Retail program, please contact our specialists for help.
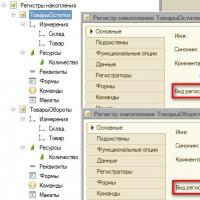 List of values of accumulation registers 1s
 Advance calculation in 1s 8
 GPC agreements Reception for GPC in 1s
 Month closing settings How to close a period in UP
 Specialist consultations
 Accounting for fuel and lubricants in 1C: instructions for accountants Write-off of fuel and lubricants 1s 8
 Issue an invoice in the 1s 8 program